
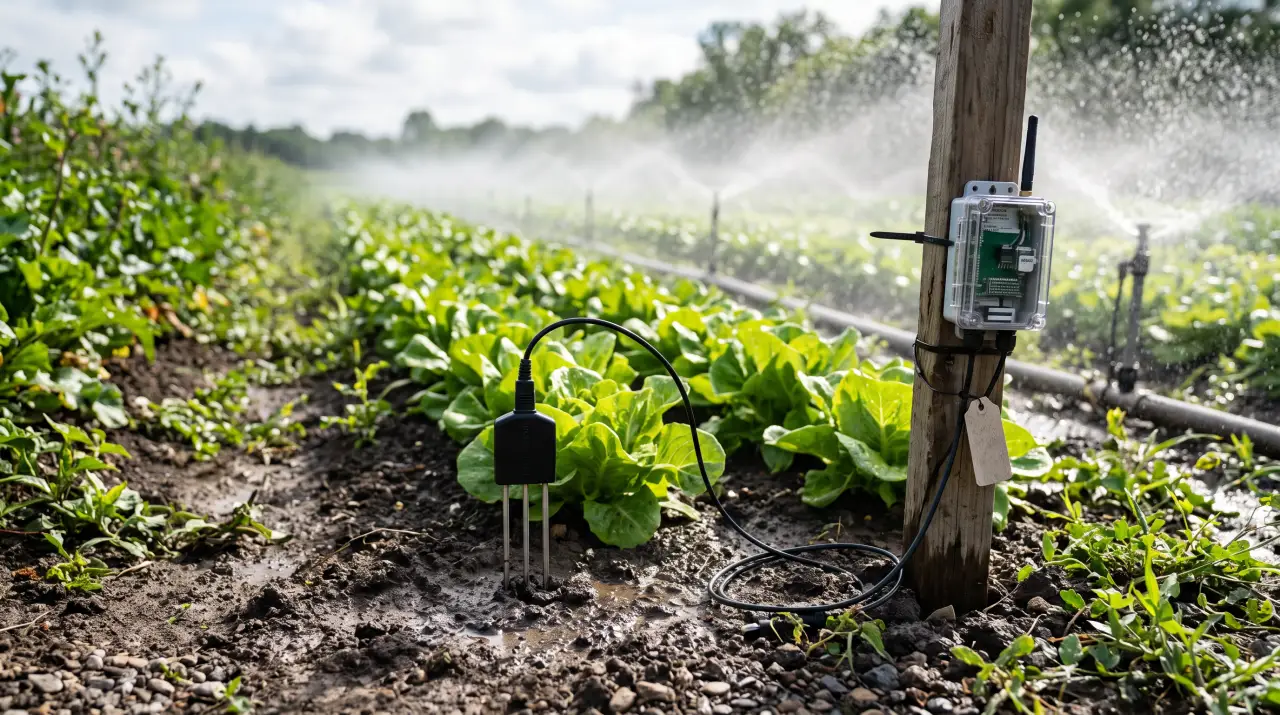
Irrigation is the place where a farm either makes or wastes the most money per acre in a single operating category. Pump fuel, electricity, pivot wear, pumping rights, labor, and the yield hit that comes from watering a day late or a day early all stack up into numbers that outpace seed, chemical, and most other input lines. For an irrigated row crop operation, the difference between a well-scheduled season and a seat-of-the-pants season is commonly five to fifteen percent of gross revenue. For a diversified vegetable or specialty crop operation, it can be more. Yet most irrigation decisions still get made by walking a corner of the field, squeezing a handful of soil, looking at the weather app, and guessing.
Scheduling irrigation with soil moisture sensors and evapotranspiration data is the category of technology that replaces that guess with measurement. The tools are not new. Tensiometers have been around since the 1920s. Evapotranspiration models have been published since the 1940s. What has changed is that the sensors have become cheap and wireless, the ET data has become free and fine-grained, and the software that stitches it all together finally runs on a phone in the cab. Operations that did not bother with scheduling tools ten years ago because the setup was too painful now have no excuse. This guide walks through how the pieces actually work, what to buy, how to install it, and how to avoid the failure modes that quietly sabotage half the sensor deployments in the country.
The traditional irrigation trigger is a mix of observation and habit. The grower walks the field, checks a couple of plants, notes whether the soil crumbles or clumps, looks at the forecast, and decides whether to start the pivot tonight or wait two days. In experienced hands this works well enough to produce an average crop. The problem is that "well enough" hides a lot of quiet waste.
The first loss is over-irrigation. Water applied past field capacity drains below the root zone, taking soluble nitrogen and a fraction of applied chemicals with it. The yield impact is invisible because the crop looks green, but the fertilizer bill and the nitrate load in the leachate are both higher than they should be. In a center pivot corn system in the High Plains, independent studies out of Kansas State and the University of Nebraska have repeatedly shown that gut-feel scheduling applies fifteen to thirty percent more water than the crop actually uses. At $8 per acre-inch of pumping cost, that is $20 to $50 per acre per season vanishing down past the roots.
The second loss is under-irrigation at the critical stage. Corn during tassel and pollination, soybeans at pod fill, almonds at hull split, wine grapes from veraison to harvest - each crop has a window where water stress translates almost directly into lost yield or quality. A scheduler working on feel tends to notice stress only after the visible symptoms appear, by which point the damage is already done. Soil moisture sensors catch a depleting profile days before the crop shows it on the leaf.
The third loss is timing relative to the pump and the weather. Running a pivot during a heat wave afternoon when evaporation is at its peak delivers less water to the root zone per acre-inch pumped than running it during the night or the early morning. Scheduling tools that integrate hourly ET data can flag the efficient windows. A paper-and-pencil scheduler cannot.
Put together, these three losses routinely amount to ten to twenty percent of the irrigation bill plus a few bushels or pounds on the yield side. On a 500-acre irrigated corn operation, that is tens of thousands of dollars a year that scheduling tools can recover, against a setup cost that usually pays back in one season.
There are three broad sensor technologies worth understanding before picking a system, because each has different strengths, costs, and installation requirements.
Tensiometers measure soil water tension, which is essentially the suction the plant has to apply to pull water out of the soil. They work well in irrigated conditions because they are most sensitive in the wet-to-moderate range where scheduling decisions actually live. Classic tensiometers are sealed water-filled tubes with a ceramic tip, read with a gauge or a digital meter. They are accurate, cheap per unit at $60 to $150, and the physics is well understood. The downside is maintenance - the tubes need refilling, the seals need attention, and a freeze or a stray tractor tire ends them. Modern electronic tensiometers like the Irrometer WATERMARK and the tensioMark reduce but do not eliminate the maintenance burden.
Capacitance and frequency-domain sensors measure the dielectric permittivity of the soil, which changes with water content. These are the probes most commonly sold by Sentek, Decagon/METER, Aquacheck, and CropX. They read in volumetric water content rather than tension, which some growers find easier to interpret - the sensor tells you directly how many inches of water are in the top two feet of soil. The accuracy depends heavily on the calibration for the specific soil type. A probe that reads accurately in a loam can be ten or fifteen percent off in a heavy clay or a sand. Professional installations include a soil-specific calibration step; cheap consumer-grade probes often skip it and deliver numbers that look precise but lie.
Time domain reflectometry and time domain transmissometry sensors are the premium option, used mostly in research and in high-value specialty crops. Brands like Acclima and Campbell Scientific sell these. The accuracy is excellent and the soil-specific calibration requirement is less severe than with capacitance. The cost is four to ten times higher, which keeps them out of most commercial row crop operations.
For a working farm, the practical choice is usually capacitance or frequency-domain probes in the mid-range - Sentek EnviroPro, METER TEROS, CropX probes, or the AquaSpy nine-sensor profile probe. Mid-range meaning roughly $400 to $1,200 per probe site, with wireless telemetry and a cloud dashboard. At that price and that accuracy, the ROI works on almost any irrigated crop above a few thousand dollars per acre in gross revenue.
The single biggest source of bad soil moisture data is bad installation. A probe shoved into disturbed soil next to a wheel track reads the wheel track, not the crop's root zone. A probe placed in the wettest corner of a pivot delivers numbers that tell you nothing about the rest of the field.
Site selection matters more than brand. The probe should sit in a representative piece of ground - not the highest, not the lowest, not next to a tile inlet or a drainage swale, not immediately downslope from a heavy equipment path. For a center pivot, one probe site near the middle of each significant soil type is the minimum. Two or three probe sites across a quarter-section pivot is common in serious installations. For a drip-irrigated row crop, a probe goes under the drip line, and a second probe goes between the rows to confirm the wetting pattern. For specialty crops like orchards and vineyards, probes typically sit at the drip line of the tree or vine.
Depth matters as much as location. Most probes read at multiple depths - typically 6, 12, 18, 24, and 36 inches for a row crop profile, or deeper for tree crops. The reason is that scheduling logic relies on seeing how the wetting front moves through the profile and where the roots are actively extracting water. A probe that only reads the top 12 inches misses the bulk of a mature corn or soybean root zone and will lead to over-irrigation.
Installation technique protects the data. The probe needs to sit in undisturbed native soil with good contact and no air gaps. The best installations use a slurry of native soil and water poured around the probe as it is inserted, eliminating voids. Shortcut installations that just shove the probe into a loose hole and backfill with dry soil produce readings that drift for weeks and can permanently read too dry.
Finally, the probe needs to survive a season. Wireless probes run on batteries, solar panels, or cell-connected gateways. Checking that the gateway has cell signal, that the solar panel is not going to be shaded by corn at V10, and that the whole unit is marked with a tall visible stake so the sprayer does not plow through it - all mundane, all skipped on a surprising number of installations, all cause of data gaps at the worst possible times.
Soil moisture sensors tell you how much water is in the soil right now. Evapotranspiration data tells you how much water the crop is using each day. Together they let you predict when the soil will hit the trigger point and schedule ahead instead of reacting after the fact.
Evapotranspiration, usually written as ET, is the combined water loss from the soil surface and from the plant through transpiration. It depends on temperature, humidity, wind, and solar radiation - in other words, the energy and atmospheric demand driving water out of the field. The standardized reference value is ET0, calculated from a weather station using the Penman-Monteith equation. The actual crop water use, ETc, is ET0 multiplied by a crop coefficient Kc that changes with growth stage.
For most irrigators, the good news is that ET0 is already available for free, calculated hourly and daily, at resolutions as fine as a few hundred meters. The California Irrigation Management Information System (CIMIS) covers the state with hundreds of stations. The Kansas Mesonet, the Nebraska Mesonet, the Texas A&M AgriLife ET network, the Oklahoma Mesonet, the Georgia Automated Environmental Monitoring Network, the Florida Automated Weather Network, the Washington AgWeatherNet, the Oregon AgriMet, and the USDA AgriMet in the Pacific Northwest all publish free ET data. For states without a mesonet, the USGS and NOAA Climate Prediction Center publish gridded ET products derived from satellite imagery. OpenET, a public-private project that went operational a few years ago, now publishes field-scale actual ET for the entire western United States at a 30-meter resolution, updated weekly.
Crop coefficients for the standard commodity crops are published in the FAO-56 guidelines and in regional extension bulletins. Most scheduling software includes a built-in library, so the grower just selects the crop and the stage. For non-standard crops - specialty vegetables, new orchard varieties, cover crop mixes - a local extension agronomist or a university irrigation specialist can usually point to the right coefficient.
The value of ET data is forecast-based scheduling. With ET numbers for the next three to seven days and a current soil moisture reading, software can predict when the soil will drop to the trigger point and recommend an irrigation start date. That is the difference between "the probe says we are at threshold, start the pump tonight" and "the probe says we are still above threshold but will hit it Thursday, schedule the pump start for Wednesday afternoon to take advantage of the cooler window."
Sensors and ET data only pay off if the grower actually looks at them and acts. The software layer is where the discipline of scheduling either sticks or falls apart.
Platform-agnostic scheduling tools include WISE (from the University of Nebraska, free), KanSched (Kansas State, free), AgriMet crop water use charts (USDA, free), and CropManage (University of California, free). These are good entry points for operations that do not want to pay a subscription. They typically require manual data entry of sensor readings and weather, which limits their utility for busy operations but makes them ideal for learning the concepts without committing to a brand.
Sensor-integrated platforms include IrriMAX from Sentek, Zentra Cloud from METER, AquaSpy, CropX, Farmlogs, and dozens of regional specialty tools. These platforms pull sensor data directly, layer it with ET, and produce depletion graphs and scheduling recommendations. Subscription costs run $300 to $1,500 per probe site per year, which includes the cellular data and the cloud dashboard.
Pivot- and pump-integrated platforms like FieldNet from Lindsay, Pivot Point from Valley, AgSense, and Reinke's RPM combine sensor data with remote pivot control, so the grower can start, stop, or adjust application depth from the phone. For operations running modern pivots, this integration is the highest-value tier of the stack because the scheduling decision and the execution happen in the same app.
An honest note on the software: most of these platforms will send you alerts, recommendations, and fancy dashboards, but they will not actually make the call. The grower still has to look at the probe trend, the forecast, and the pivot timing, and push the button. The scheduling tools reduce the guesswork, not the responsibility.
A soil moisture probe without trigger thresholds is just a pretty graph. The thresholds are what turn it into a scheduling tool.
The starting point is two numbers per soil depth: field capacity and refill point. Field capacity is the upper limit, the amount of water the soil holds after gravity has drained the excess. Anything above field capacity is wasted because it will drain past the root zone. Refill point is the lower limit before the crop starts experiencing stress, typically set at 50 percent of plant-available water for most row crops and 30 to 40 percent for stress-sensitive stages or crops.
The grower's job is to keep the profile between those two numbers. Irrigate when the depletion reaches the refill point, stop when the profile returns to field capacity, and do not exceed either limit. A graph of profile depletion with the two thresholds overlaid tells the whole story at a glance.
Setting the two numbers requires some soil knowledge. Field capacity and refill point both depend on soil texture - a sandy loam holds much less available water per foot than a silt loam or a heavy clay. Extension services publish the values by soil series, and most scheduling platforms either include the defaults or let the grower enter them. For a first-time installation, using the published values for the dominant soil series is accurate enough to start with. Fine-tuning comes from watching how the sensors respond to known irrigation amounts over the first few weeks of the season.
Crop stage adjusts the refill point. During vegetative growth, most crops tolerate a deeper depletion without yield loss, so the refill point can sit at 50 percent. During reproductive stages, the refill point rises to 35 or 40 percent because stress during flowering or fruit fill hits yield hardest. A good scheduling platform lets the grower build a crop stage calendar and adjusts the trigger automatically.
A working example makes the stack concrete. Consider a 125-acre pivot corner of irrigated corn on a silt loam with 2.0 inches of plant-available water per foot and a four-foot effective root zone. Field capacity across the profile is 8.0 inches of available water. Refill point at 50 percent is 4.0 inches of depletion, and at the R2 to R4 reproductive stages it tightens to 35 percent, or 2.8 inches of depletion.
The pivot has a Sentek three-foot profile probe installed in a representative midfield location, reading at 10, 20, 30, and 36 inches every 15 minutes, uploading hourly to the Zentra Cloud platform. The local CIMIS station publishes hourly ET0. The scheduling app shows daily crop water use and a depletion trend line.
At V10 in early July, the probe shows 3.2 inches of depletion, forecast ET says 0.28 inches per day for the next three days, and no rain in the forecast. The app projects the refill point will be hit on day three. The grower schedules the pivot to start on the evening of day two, applies 0.75 inches to bring the profile back up without pushing past field capacity, and watches the probe confirm the refill.
Ten days later the crop hits VT and the scheduling app tightens the refill threshold to 2.8 inches. ET jumps to 0.35 inches per day during a hot spell. The probe hits threshold two days earlier than the previous cycle. The grower triggers the pivot and also shortens the pass length slightly because the forecast shows a chance of a storm in three days. If the storm hits, the lighter application prevents saturation. If it does not, the next cycle catches up.
Across the season, this stack applied 16.2 inches of irrigation, compared to the neighbor across the road on the same soil and the same hybrid who applied 21.8 inches on a calendar schedule. The yield difference was within noise - both fields made 235 to 245 bushels. The pumping cost difference was $45 per acre. On the full pivot, that was $5,600 saved in one season against a scheduling setup that cost about $3,800 for the first year and $1,400 per year after that.
Those numbers are not magic. They match a decade of Kansas State, Nebraska, and Oklahoma extension bulletins on irrigation scheduling ROI. What is new is that the tools that used to require a wired weather station, a hand-probed reading three times a week, and a spreadsheet now run automatically on any smartphone.
The technology works. The places where it fails are predictable.
Ignoring the probe is the most common failure. Growers install sensors, get the app, and check it three times in May, once in July, and not at all in August. The probe data is still there, quietly doing its job in the cloud, but the scheduling decisions are being made by habit again. The fix is a discipline of looking at the dashboard at a fixed time each day during the irrigation season, or setting up alerts that trigger on approaching thresholds and reading them on arrival.
Poor site selection is the second. A single probe in an atypical spot produces data that confuses rather than clarifies. If the operation has materially different soil types in the same field, spending the extra $1,000 for a second probe site is nearly always worth it. If the field is uniform, the single probe just needs to be in an honestly representative spot, not a convenient one.
Cellular and battery failures are the third. Solar-powered gateways die when a growing crop shades them. Batteries fade in the second and third seasons. Cell coverage gaps mean some stations drop data for days at a time. A mid-season walk of every probe site, checking battery voltage, panel alignment, and data continuity, catches most of these before they cost a cycle.
Chasing the wrong numbers is the fourth. Some growers treat the probe reading like a race-car telemetry screen and try to micromanage to tenths of an inch. The physical system does not respond that finely - a pivot takes a day to traverse the field, an irrigation cycle takes a day or two to show up in the profile, and soil moisture has natural hysteresis. Making decisions on daily average data and weekly trend lines is more useful than obsessing over hourly wiggles.
Finally, ignoring the weather forecast is a classic failure. A probe at threshold with a two-inch rain coming in 18 hours is a different situation from a probe at threshold with a dry forecast. The software usually integrates the forecast, but only if the grower actually set the forecast location correctly and accepts that the forecast is sometimes wrong.
For a typical irrigated row crop operation, the minimum viable stack is one capacitance profile probe per significant soil type per field, a subscription to the sensor platform's cloud service, free ET data from the nearest public mesonet, and a disciplined daily habit of looking at the dashboard during the irrigation season. Initial cost runs $800 to $1,500 per probe site, with annual costs of $400 to $900 per site for data and dashboards. For a 500-acre irrigated operation with four pivots and two probe sites per pivot, that is a first-year investment of $8,000 to $12,000 and an annual cost of $3,500 to $7,000.
For a higher-intensity operation - specialty vegetables, orchards, vineyards - the stack moves up to two or three probes per significant zone, weather stations on-site for localized ET, pivot or drip integration for remote control, and sometimes TDR-grade sensors for the critical zones. The cost doubles or triples, but so does the per-acre revenue and the yield sensitivity.
The thread that runs through every successful installation is the same: someone on the operation owns the scheduling decision, looks at the numbers every day during the season, and adjusts the plan when the data says to. The sensors and the ET feed are not a substitute for that attention. They are the leverage that turns the attention into measurable savings and steadier yields. Farms that buy the hardware and expect it to schedule for them end up disappointed. Farms that treat it as a disciplined information system end up keeping the savings year after year, which is what irrigation scheduling technology is actually for.
Field studies from Kansas State and the University of Nebraska show gut-feel scheduling applies fifteen to thirty percent more water than the crop actually uses. At $8 per acre-inch of pumping cost, trimming that overage recovers roughly $20 to $50 per acre each season, before counting the fertilizer saved by keeping nitrogen from leaching below the root zone.
Tensiometers measure soil water tension, the suction a plant applies to pull water free, and cost $60 to $150 per unit but need refilling and seal upkeep. Capacitance and frequency-domain probes measure volumetric water content and read directly in inches of water, running $400 to $1,200 per probe site, though their accuracy hinges on soil-specific calibration for the exact soil texture.
A row-crop profile probe should read at multiple depths, typically 6, 12, 18, 24, and 36 inches, so the scheduling logic can track the wetting front and the active root zone. A probe reading only the top 12 inches misses most of a mature corn or soybean root system and steadily pushes the grower toward over-irrigation.
Public mesonets publish free ET0 data, including CIMIS in California plus the Kansas, Nebraska, Texas A&M, Oklahoma, and Washington networks. OpenET now delivers field-scale actual ET across the entire western United States at 30-meter resolution, updated weekly, so most irrigators can pull ET numbers without owning a private weather station.
Join our list for practical guides on farm tech, precision agriculture, and tools that work.