
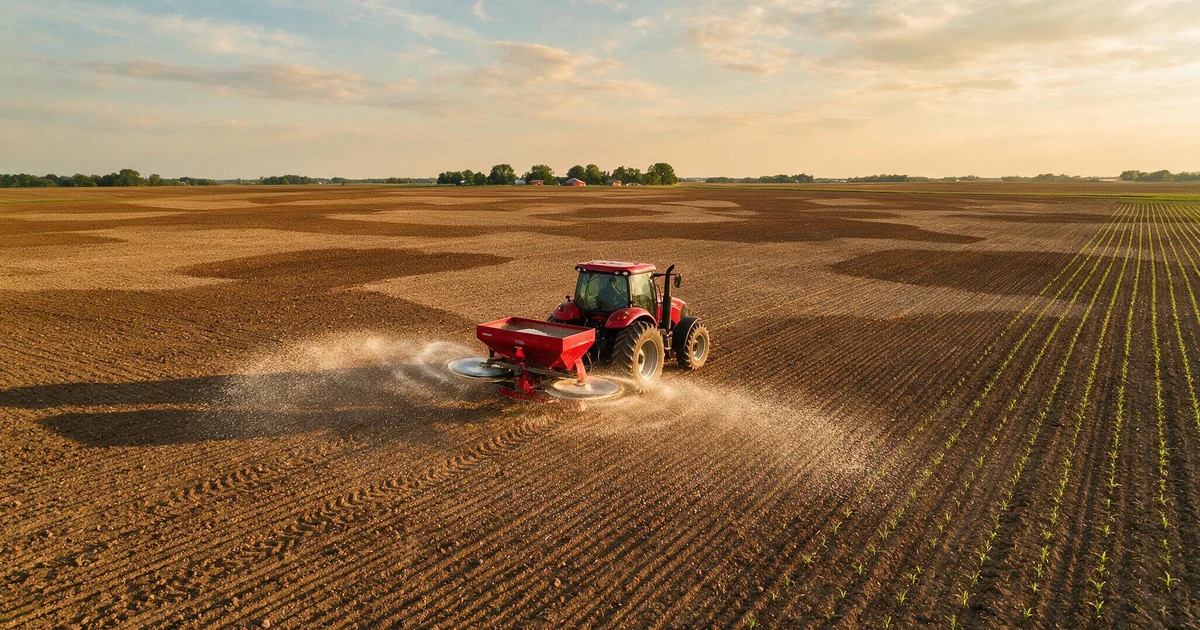
Variable-rate fertilizer application uses a soil-test prescription map to change the pounds of dry phosphorus, potassium, or lime dropped as the spreader moves across a field. A GPS rate controller adjusts the metering on the go, so high-testing ground gets less and deficient ground gets more instead of one flat rate everywhere.
If you take one thing from this article, take this: for phosphorus (P) and potassium (K), the honest payoff is almost never a yield bump. It is redistribution. You stop dumping expensive fertilizer on ground that already tests high, move it to the acres that are actually short, and keep phosphorus out of the ditch. That is a real return, but it is a different return than the vendor brochures promise, and understanding the difference changes how you build the whole prescription.
This piece is about dry granular P, K, and lime on a soil-test map. It is not about seeding rate, which we cover in variable-rate seeding prescription maps, and it is not about in-season nitrogen, which behaves completely differently and is covered in variable-rate nitrogen sidedressing. Nitrogen is mobile and applied in-crop. P and K are immobile, stockpiled in the soil over years, and applied on build-and-drawdown logic. Keep those lanes separate or you will build a bad prescription.
At its simplest, variable-rate technology (VRT) is a map plus a controller. The map is a prescription: a grid or set of zones across your field, each carrying a target rate in pounds per acre. The controller is a rate box wired to GPS on the spreader that reads your position, looks up the target rate for that spot, and speeds up or slows down the conveyor or metering system to hit it. Cross a line into a low-testing zone and the rate climbs. Cross into a high-testing zone and it drops, sometimes to zero.
The hardware to do this is now standard-issue on new dry spreaders. The barrier is not the iron. It is the prescription and the soil sampling underneath it, which is exactly the part most operations skimp on.
Here is the uncomfortable finding the vendor pages leave out. Long-term on-farm research from Iowa State (Mallarino) compared uniform and variable-rate P and K across roughly fifty site-years on commercial fields with clear soil-test variation. Statistically significant grain-yield differences showed up in only a handful of those site-years for phosphorus and fewer still for potassium. In other words, most of the time, switching from a flat rate to a variable rate did not move the yield needle at all.
That does not mean VRT is a waste. It means you have to justify it on the right grounds. The defensible wins are:
If a field genuinely tests uniform from corner to corner, variable rate may not clear the cost of the extra sampling and mapping. VRT pays on variable fields, not flat ones. Test before you invest in the prescription.
The single most common misconception, and the one the brochures encourage, is that variable rate means feeding your best ground more. For nitrogen and seed that framing can hold. For P and K it is backwards.
Your high-yielding, high-testing acres often already have plenty of phosphorus and potassium in the bank. Applying more there is money set on fire. The acres that need attention are the low-testing ones, and those are frequently your weaker-yielding ground. So a correct P and K prescription usually means applying less on the strong ground and more on the weak ground. If your VRT plan has you piling fertilizer onto the good corners, someone sold you the seeding logic and stapled it to the wrong nutrient.
Once you accept that the map is about placement, you have to pick the philosophy that sets the numbers. There are two mainstream approaches.
Build-maintenance-drawdown is the dominant extension framework (Michigan State, Ohio State, and most of the Corn Belt). It works in three bands against your soil test:
Crop-removal replacement is the simpler cousin: replace what the grain hauled off. A one-to-one removal-replacement ratio roughly maintains reserves long term, a 1.5-to-1 ratio builds them, and a 0.75-to-1 ratio spends them down about 25 percent.
There is a fresh caution worth building into the removal math. A July 2026 farmdoc daily analysis (Bergschneider, Freiberg, and Margenot) points out that state recommendations often use the 75th-percentile grain-removal value. That means book removal numbers overestimate actual P and K removal for three out of every four grain samples. Corn removes roughly 0.37 lb P2O5 per bushel and 0.20 to 0.29 lb K2O per bushel; soybeans pull far more, around 0.72 to 0.80 lb P2O5 and 1.15 to 1.40 lb K2O per bushel. If you build a crop-removal prescription on book values, you will tend to over-apply and overspend unless you are actually measuring your own grain nutrient content.
The prescription is only as good as the sampling under it, and this is where both the real cost and the real error live. The spreader executes the map. It does not know if the map is wrong.
Grid sampling at 2.5 acres is the most common and most cost-effective grid, with typical grids running anywhere from 1 to 5 acres. Sampling itself runs roughly 3 to 8 dollars per acre before lab analysis, and the tighter the grid the more samples you pull and the higher the bill. A 2025 Agronomy Journal grid-size study on corn found that a 0.4-hectare grid (about one acre) best captured the spatial variability of pH, P, and K and produced the most accurate prescription maps. The catch is that finer grids cost more, so it is a variability-versus-budget tradeoff, not a free upgrade.
Zone sampling is the alternative. Zones are cheaper to sample than a dense grid because you pull fewer composite samples, but they cost more to delineate up front and are only as good as the layers used to draw them, such as soil electrical conductivity or bare-soil imagery. If you want to go deeper on zone delineation, see soil EC mapping and Veris zones.
A tempting shortcut is to build a P and K map straight off the yield monitor: high yield means high removal means more fertilizer. Extension agronomists warn against it, and the redistribution logic explains why. Yield removal tells you what left the field, not what is left in the soil. Your deficient, needs-building acres are often the same low-yielding zones a pure removal map would starve. Yield and removal data belong in the maintenance calculation, layered on top of your soil tests, not standing alone as the prescription. Calibrate your monitor first so that removal data is even trustworthy; see yield monitor calibration.
Dry spreaders apply the prescription through a rate controller and GPS that change the conveyor or metering speed while you drive. Two broad styles cover most farms.
Spinner spreaders fling product from spinning discs. They are cheaper, throw a wide swath, and are what most operations already own, but the spread pattern varies more and drifts more in wind. The New Leader NL720 is a common example, hydraulically driven with independent variable spinner speed and automatic ground-speed conveyor control.
Air-boom spreaders place product into a defined swath through boom outlets. They give a more even pattern, less wind drift, and cleaner section shutoff, at higher cost. Salford's granular units (the Valmar 9620 air-boom and AB640, plus the Sniper spinner) support section control and variable rate through ISOBUS and a third-party rate controller, applying up to around 1,200 lb per acre at speeds up to 10 mph.
Pricing on this iron is not publicly listed in any way worth quoting, so treat any number you hear as a dealer quote and nothing firmer.
You do not need to commit to full grid sampling to start saving money. If your spreader supports automatic section or swath shutoff, you get the same overlap savings you already understand from sprayer section control. On headlands, point rows, and odd-shaped fields, section control stops the spreader from double-applying expensive P and K where passes overlap. That is a concrete, low-controversy dollar saver that works even before you have a single grid sample on file. If you run section control on your planter and sprayer already, extending the habit to the spreader is the natural next step; see section control on planters and sprayers.
Do not grade a P and K program on the yield line, because, as Iowa State showed, the yield line usually will not move. Grade it on the soil test. Re-sample on your normal cycle, typically every three to four years, and watch two trends: your high-testing zones should drift down toward the maintenance range as you quit feeding them, and your deficient zones should climb toward their critical level as you redirect fertilizer to them. If both trends are happening, the prescription is doing its job, and your fertilizer dollars are landing where they earn their keep. Pair the re-sampling discipline with a good baseline; our soil testing guide walks through pulling samples that actually represent the ground.
Reading your own ground well enough to zone it, layer imagery over it, and turn GPS data into a real plan is exactly the skill this whole exercise rewards. If you want that in one place, The Land Atlas is our free 180-page field guide to reading your land through water, soils, imagery, and GPS, with a year-one action plan you can actually run. It will not spread the fertilizer for you, but it will help you build the map that tells the spreader where to put it.
Usually not for phosphorus and potassium. Long-term Iowa State on-farm trials found statistically significant yield gains in only a handful of site-years out of roughly fifty. The real payoff is redistribution and input efficiency: you stop over-applying on high-testing ground, correct deficient acres, and cut phosphorus runoff. Justify variable rate on cost and environmental grounds, not a promised yield bump.
Grid soil sampling typically runs about 3 to 8 dollars per acre before lab analysis, and the tighter the grid the higher the cost because you pull more samples. A 2.5-acre grid is the most common and most cost-effective choice. Finer grids near one acre map variability more accurately but cost more, so the decision is a tradeoff between map precision and your sampling budget.
No, not on its own. A yield map shows what nutrients left the field as grain, not what remains in the soil. Your deficient, needs-building acres are often your lowest-yielding zones, so a pure yield-removal map can starve exactly the ground that needs building. Use yield data inside the maintenance calculation, layered on soil tests, never as a standalone prescription.
A spinner spreader flings dry product from spinning discs. It is cheaper, throws a wide swath, and is common, but the spread pattern varies more and drifts in wind. An air-boom spreader places product through boom outlets for a more even pattern, less drift, and cleaner section shutoff, at higher cost. Both can execute variable-rate prescriptions with a GPS rate controller.
You need a dry spreader with a GPS rate controller that can read a prescription map and change the metering rate on the go. Most new spreaders ship with this capability through ISOBUS. Section control, which shuts off application on overlaps, is a related feature that saves fertilizer even before you adopt full grid-based variable rate.
Join our list for practical guides on farm tech, precision agriculture, and tools that work.