
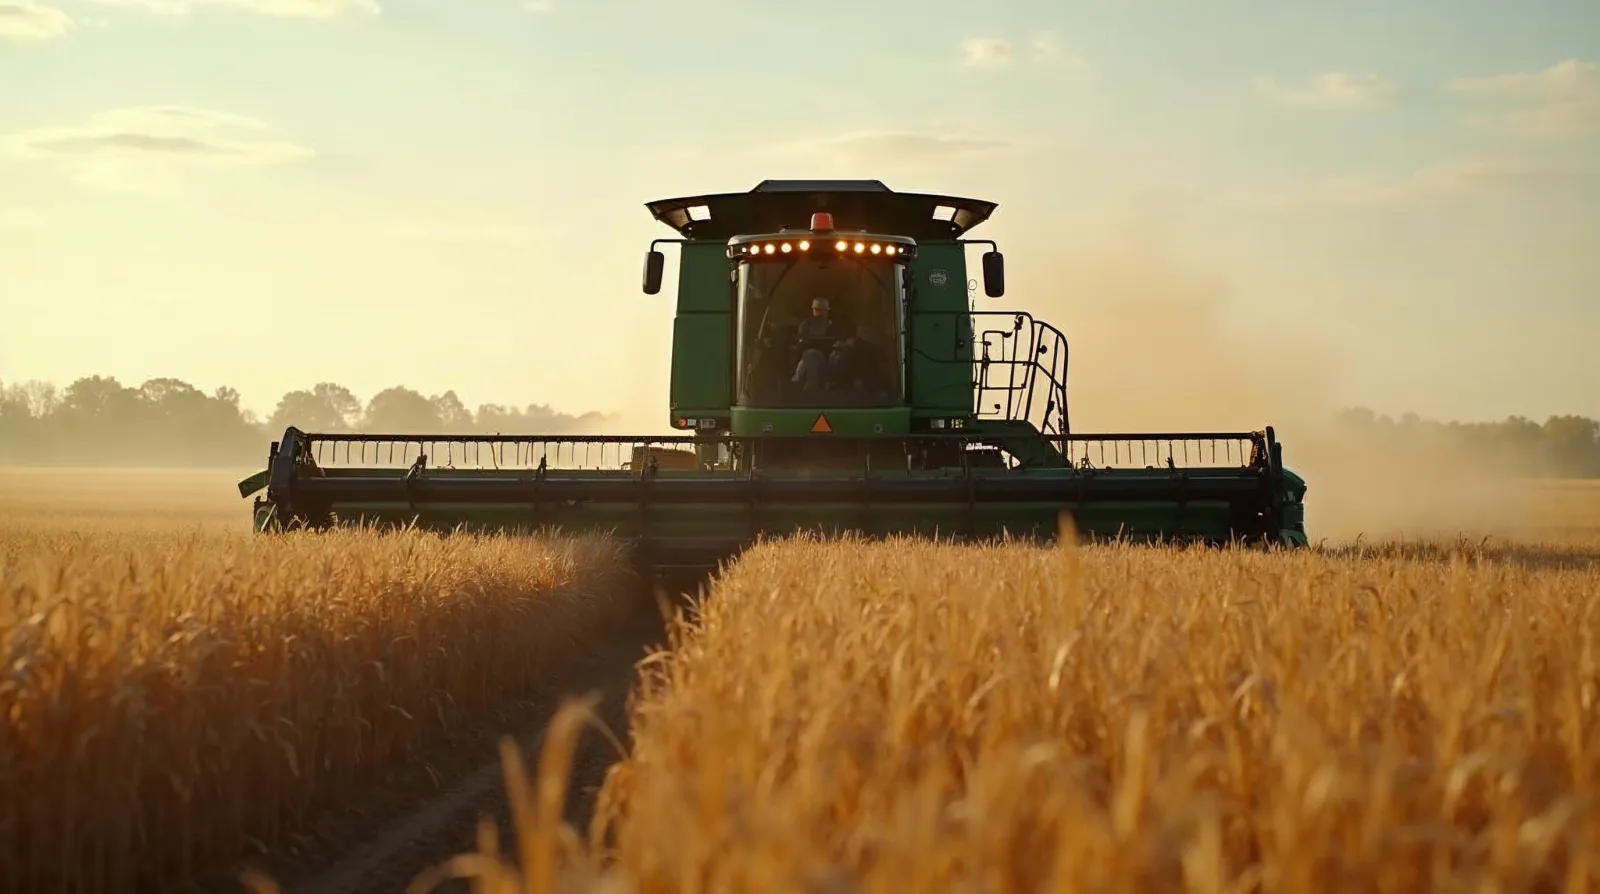
For as long as combines have had grain tanks, the answer to the most important question of harvest - what is this crop actually worth - has lived somewhere other than the cab. It lives at the elevator's probe, or in the sample bag that rides to the co-op office, or in the discount schedule that gets read out over the phone after the truck is already weighed and dumped. By the time a grower learns that a load of milling wheat came in at 11.8 percent protein instead of the 12.5 the contract wanted, the grain is gone, the bin is committed, and the only decision left is whether to argue about the dock. The information arrives after every decision it could have informed has already been made.
An on-combine grain quality sensor moves that information forward in time. It is a near-infrared analyzer that scans a sub-sample of grain as it pours into the tank, every five to twelve seconds, and reports protein, moisture, oil, and starch tied to GPS coordinates. The cab screen builds a quality map of the field the same way a yield monitor builds a yield map. The grower knows what is in the tank before it leaves the field. That single shift - from quality as an after-the-fact discount to quality as a live data layer - is what the technology is selling, and it is worth understanding clearly before deciding whether it belongs on your combine.
The hardware is a near-infrared spectrometer mounted on the clean grain elevator or fed by a small auger into a sample chamber. As grain moves past, the instrument shines near-infrared light through or onto the kernels and reads how much of that light comes back at different wavelengths. Protein, oil, starch, and water each absorb infrared energy in characteristic ways, so the reflected or transmitted spectrum carries a fingerprint of the grain's composition. A calibration model converts that fingerprint into numbers, and those numbers display in the cab and write to a log point with a GPS stamp.
There are two optical approaches worth knowing the difference between, because they map onto the two kinds of systems on the market. Reflectance instruments bounce light off the surface of the grain and read what comes back. Transmission instruments, often called NIT for near-infrared transmission, pass light all the way through a column of whole kernels and read what makes it to the other side. Transmission tends to be the approach used for whole-grain protein work because it samples the inside of the kernel rather than just the surface, and it is what the elevator's benchtop tester usually uses too. The practical takeaway is not that one is universally better, but that whole-grain NIT is the established method for protein, and the on-combine units built around it are doing a known measurement under harder conditions.
The CropScan 3300H, one of the most common aftermarket systems, measures protein, oil, starch, and moisture in grains and oilseeds every five to twelve seconds as they are harvested, collecting the scan as grain passes up the clean grain elevator and fills a remote sample head. The results show up in the cab as field data, field maps, graphs, and tank averages, and sync to a cloud account for later analysis. That is the whole loop in one sentence: scan a sub-sample, read composition, tag it to a location, build a map, keep the data. It is the quality counterpart to the yield monitor, and the comparison is exact enough to be useful. A yield monitor measures bushels per acre as you go. A quality analyzer measures dollars per bushel as you go.
There are two genuinely different paths onto a combine, plus a third option worth a mention, and the choice is more about your fleet than about which sensor is sharper.
The first path is aftermarket and brand-agnostic. The CropScan 3300H from Next Instruments fits, in the maker's words, nearly any combine brand or model, with installation kits for CNH, AGCO, CLAAS, and John Deere machines. It is a near-infrared transmission analyzer with a remote sample head plumbed into the clean grain elevator. It uses four selectable cell pathlengths to handle different seed sizes - 30 mm for corn, 24 mm for large seeds, 15 mm for cereal grains, and 7 mm for canola - and the sampling head was reworked to keep corn flowing even up to around 22 percent moisture. Its crop list is broad: wheat, barley, corn, soybeans, canola, sorghum, oats, lentils, peas, and lupins. The same system now ships factory-fitted on John Deere X9 combines and is integrated into the next-generation Case IH and New Holland dual-monitor setups under the CropScan 4000VT name. If you run a mixed-color fleet or a wide rotation, the aftermarket route keeps one system and one calibration workflow across all of it.
The second path is brand-integrated. John Deere's HarvestLab 3000 Grain Sensing is a dealer-installed kit for S700 Series combines from model year 2018 and newer. A motor-driven auger pushes grain in front of the HarvestLab 3000 near-infrared sensor, which records and maps moisture, protein, starch, and oil every second, with the data viewable in the cab or in John Deere Operations Center. Pay attention to the crop scope here, because it is narrower than the aftermarket unit: Deere markets grain sensing for wheat, barley, and rapeseed or canola - small grains and oilseeds, not corn and soybeans. The offsetting strength is that the same HarvestLab 3000 sensor also does forage constituent sensing on a forage harvester and manure nutrient sensing on a spreader. If you are a Deere operation already and your quality questions sit on wheat and canola, one sensor doing three jobs across the year is a real argument.
The third option, less common in North American fields but worth naming, is Dinamica Generale's EVONIR, an on-board near-infrared analyzer installed along the grain flow to continuously scan harvested grain for moisture, protein, and other values in real time. The honest way to frame all three is open-and-aftermarket versus brand-integrated, not good versus bad. The right answer depends on what you run and what you grow.
This is the section that separates an honest discussion from a brochure, so here it is plainly. An on-combine analyzer is map-grade, not trading-grade, and it is built that way on purpose.
The peer-reviewed field work is encouraging for what the sensor is meant to do. In on-combine validation, near-infrared protein prediction has come in around an R-squared of 0.94 with a standard error of prediction near 3.1 grams per kilogram, which is about 0.31 percent protein; on soft white winter wheat validation sets the figures were an R-squared of 0.91 and the same roughly 3.1 gram-per-kilogram error. In one study a combine-mounted instrument produced a protein map that correlated at r equals 0.88 with a map from an expensive research-grade reflectance spectrometer. Translated into terms that matter in the cab: the sensor is good enough to trust the pattern across the field - which zones run high, which run low, where the line falls - and that is exactly what a map needs to be useful.
What it is not is a substitute for the elevator's tester. Top benchtop NIR systems typically quote around plus or minus 0.1 percent protein accuracy, built on calibration datasets running to fifty thousand samples or more, and most makers recommend annual calibration checks even on those. The on-combine number, at roughly plus or minus 0.3 percent and looser, is several times wider. You do not want to settle a contract to the tenth of a percent on the moving sensor's say-so. You want to use it to decide where this truck should go, and let the scale ticket and the official probe set the final number. Treat the in-cab reading as a confident estimate of the pattern, not as the figure of record.
Calibration is the catch, and it deserves more than a footnote. Near-infrared grain models are crop-specific, variety-specific, and often season-specific, and they drift. A sensor that suddenly reads off is far more often a calibration that needs a fresh check than a sensor that has failed. Plan on seasonal calibration verification against known samples the same way you plan on a load calibration for the yield monitor. In fact, the two practices reinforce each other, because a protein map laid over a yield map is only as honest as the yield layer underneath it. If the yield monitor is off, the quality map inherits the error in every dollars-per-acre calculation you build on top. Anyone serious about quality mapping should have yield monitor calibration squared away first - the two are a package.
The first place the sensor pays is the simplest to explain, because it happens during harvest. When you know the protein and moisture of what is in the tank before the grain leaves the field, you can route loads instead of averaging them.
That means keeping the high-protein wheat together for a milling premium contract rather than blending it down into the general bin. It means blending strategically to just clear a spec rather than overshooting and giving away quality you were not paid for. It means pulling the wet grain out for the dryer instead of burying it in a dry bin where it raises the moisture of everything around it and turns into a storage problem in February. John Deere frames the in-cab readout as letting operators make grain marketing decisions on the go, and that is the honest description of the in-season payoff. The map tells the trucks where to go.
This is where the sensor connects to the rest of the harvest data stack. Segregating by quality only works if you can move and track loads cleanly, which ties into grain cart weigh systems and harvest logistics and into grain bin monitoring once the grain is binned by grade. Knowing your quality early also feeds the marketing side directly, which is the subject of grain marketing and hedging apps - a protein number in the tank is a negotiating position before the load is ever weighed. The sensor does not replace any of that. It feeds it better information, earlier.
One caution keeps this honest: the marketing payoff assumes your buyer actually pays for quality. Milling wheat protein premiums, malting barley specs, and oilseed oil content all carry real money, and moisture discounts are nearly universal. But in a straight feed-corn operation selling into a local market that pays the same regardless of protein, the segregation case is much weaker. The value here is crop-specific and market-specific, and it is worth being blunt with yourself about whether your buyers reward what the sensor can measure.
The second payoff plays out over seasons rather than during harvest, and for grain operations it is often the more durable one. Protein is, among other things, a readout of how well the nitrogen supply met the crop's demand. Lay a protein map over a yield map and four zones tend to sort themselves out.
High yield with adequate protein means nitrogen was about right - the crop made bushels and still had enough nitrogen to fill out protein. High yield with low protein is the classic under-fertilized signature: the crop chased yield and ran the nitrogen out, diluting protein across a big harvest. Low yield with high protein usually means something other than nitrogen capped the yield - moisture, disease, compaction - and the leftover nitrogen concentrated in a smaller grain mass. Low yield with low protein points to a genuinely poor zone with a deeper problem. Each quadrant is a different agronomic story, and the protein map is the only layer that lets you tell them apart.
The high-yield, low-protein zones are where the money question lives. For hard wheats, the market reference is concrete: hard red winter wheat is commonly specified around 12.5 percent protein, and price steps down as protein falls below that line. A map of where you came up short on protein is, functionally, a map of where next season's nitrogen has the best chance of paying for itself - whether through a higher base rate, a split application, or a late-season top-up aimed at protein. That is the direct bridge to variable-rate nitrogen sidedressing, where the protein map becomes a prescription input rather than just a pretty picture. The same data also supports a rough accounting of nutrient removal - protein times yield approximates the nitrogen hauled off the field - which is a reasonable planning input for next year's fertility budget, as long as you treat it as a planning number and not a precise nutrient ledger.
The price has to be on the table because it sets the whole decision. An independent buyer guide puts an on-combine NIR analyzer at around ten thousand dollars and up depending on configuration, which is well above a benchtop grain-protein tester and squarely in large-acre, custom-harvest, or quality-premium territory. No public list price exists, so the realistic move is to get a quote for your specific combine and confirm the install details before budgeting. That single ten-thousand-dollar figure comes from one buyer-guide source, so treat it as an order-of-magnitude anchor - expect five figures, get a real number from the dealer - rather than a fixed sticker.
At that price, the math is not subtle. The sensor earns its keep if you grow a crop where composition is worth money - milling wheat, malting barley, oilseeds priced on oil, or any contract that docks moisture hard - and if you farm enough acres or harvest enough custom volume that a per-acre quality gain adds up to real dollars. It also earns its keep if you have a credible shot at trimming or retargeting nitrogen using the protein map, because nitrogen is one of the largest controllable costs on a grain operation and even a modest improvement in placement compounds.
It is the wrong purchase if you grow a crop nobody pays a quality premium on, if your acreage is small enough that a five-figure sensor cannot amortize, or if you do not yet have a quality decision you would actually act on. The technology does not create a reason to care about protein. It rewards an operation that already has one. And it samples rather than weighs - it reads a sub-sample every few seconds riding alongside the yield monitor, not a hundred-percent inspection and not a scale - so it belongs in the decision-support column, not the official-measurement column.
An on-combine grain quality sensor is a second data layer built on the go, the quality companion to the yield map, and like the yield monitor it is only as good as its calibration and only valuable if you act on what it shows. The two payoffs are distinct and worth separating: real-time marketing and segregation that pay during harvest, and protein mapping that pays into next season's nitrogen plan. Field accuracy is map-grade, not trading-grade, which is the right tool for routing loads and finding nitrogen-limited zones and the wrong tool for settling a contract to the tenth of a percent. At ten thousand dollars and up, it is a large-acre or quality-contract play, not a starter purchase. The clean test is this: if you already have a quality decision you would make differently with better information sooner, the sensor hands you that information in the cab instead of at the scale. If you do not, the map is just a map.
If you are working through which harvest-data tools actually earn their place on your operation, that is exactly the ground we cover here every week - from yield monitor calibration to grain marketing tools to variable-rate nitrogen. You can follow along and get new breakdowns like this one by signing up for the Manley Farms email list, and the running dashboard on the site tracks the ag-tech worth paying attention to. No pitch, no sponsor reading the numbers for us - just the honest version of whether a given tool pays.
They are map-grade, not trading-grade. Field validation puts protein prediction near an R-squared of 0.94 with a standard error around 0.31 percent protein, so roughly plus or minus 0.3 percent. That is several times looser than a benchtop tester's plus or minus 0.1 percent. Trust the sensor to show the pattern across the field and let the elevator's official probe set the contract number.
It samples continuously as grain flows up the clean grain elevator. The CropScan 3300H scans a sub-sample every five to twelve seconds, while John Deere's HarvestLab 3000 records moisture, protein, starch, and oil every second. Each reading is tagged to a GPS point, so the cab screen builds a quality map of the field the same way a yield monitor builds a yield map.
Expect a five-figure investment. An independent buyer guide anchors an on-combine near-infrared analyzer at around ten thousand dollars and up depending on configuration, well above a benchtop grain-protein tester. There is no public list price, so get a quote for your specific combine. At that cost, it is a large-acre, custom-harvest, or quality-premium purchase rather than a starter tool.
It depends on the system. The aftermarket CropScan 3300H handles a broad crop list including corn, soybeans, wheat, barley, canola, sorghum, oats, lentils, and peas, using four selectable cell pathlengths for different seed sizes. John Deere's HarvestLab 3000 grain sensing is marketed only for wheat, barley, and canola, so corn and soybean growers need the brand-agnostic route.
Join our list for practical guides on farm tech, precision agriculture, and tools that work.